

Organising and analysing the data
Now that you have started doing your user research, it is time to organise the data. I recommend doing this as you go, so that it minimises the amount you need to do at the end of the research phase.
For organising and analysing the data, I suggest using Microsoft Excel. It is a brilliant way to split up quotes and then individually categorise them so you can see themes. This process is called ‘Coding’.
About the coding process
Coding is the process of identifying themes through the organisation of data. It allows you to see the relationships between different insights and to understand what the consensus is regarding your research topic.
When coding, you would tag different quotes with a category. This allows you to see which categories are reoccurring. Categories should be given names that link to the general theme of the quote. For example, the quote might be ‘People go to the library with many different requests’ which has been labelled with the category ‘Finding Information / Getting Help’. This means that any other quotes that are about how people find out about things will also fit within that category.
If there is a particularly long quote within the research, but the quote has elements that are saying different things, it is important to split these out as would need to be coded differently.
Below is an example of a spreadsheet structure ready for the coding of qualitative data.
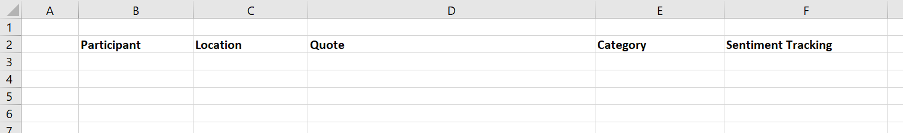
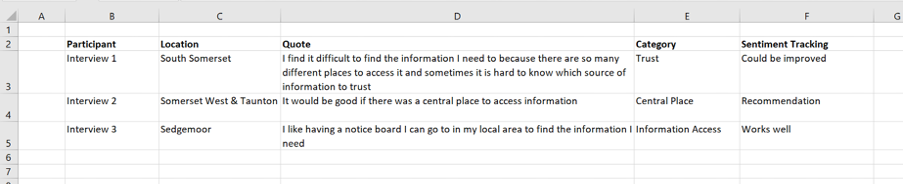
You would add the participant number or name (depending on the level of consent) then if you know the specifics of where they live, you can include this to ensure demographic representation. Following this, you would add the quote of which you would categorise depending on what the quote is saying. Below is an example of the beginnings of codifying research data.
Sentiment Tracking
Now that you have tagged the quote with a category, it is important to understand the nature of the quote. This is done through sentiment tracking which allows us to understand what the quote means.
Sentiment Tracking headings include:
- Could be improved – This means that the quote is outlining a negative with the experience which should be improved in future innovations. Those within ‘could be improved’ typically outline a problem.
- Works Well – These are aspects of the research topic which participants are happy with or feel are a good element of the service. Typically these factors should stay the same or be built upon in future innovations.
- Recommendation – These are suggestions made based on the participant’s knowledge and experience of the research topic.
- Neutral – These are research statements without any emotional charge.
The sentiment tracking headings outlined here can be changed depending on your research topic and preference.
Themes, epics, features and user stories
In the ‘Beginning a user research project’ section, we outlined how the Digital and ICT Transformation Teams follow an agile process. We are now conducting an analysis which sits towards the end of the discovery phase.
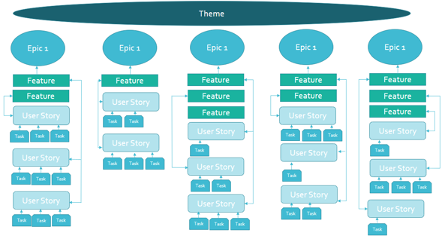
After analysing the data it is vital that we use the insights to inform the solution process. In the agile process, we do this by translating insights into themes, epics, features, user stories and tasks.
Identifying key themes
Now you have coded and organised the data, it is time to find the key themes. Through the categorisation process, you will have started to notice themes within the research. The most valuable way is to go further in your coding by looking into each category and starting to organise quotes into themes and epics.
The categories are there to help you navigate the data but now we need to understand them in more detail and get to the root of what they were saying.
Example
Quote: It is very difficult for new mums on their own with no support around them, no friends with babies or they are new to the area to find information and know what is going on in the local area.
Theme: 1. Finding the help you need
Epic: 1.1. Where to start
This means we have overarching themes that have come from the research which then contain epics. These epics will then contain user stories to be used to inform the features that make up that epic.
In our example theme ‘1. Finding the help you need’ has the following epics:
- Knowing where to start
- Joined Up systems
- Knowing what you need
- Too much information
This shows that whilst you have an overarching theme, there are different elements to it which are represented as epics. This means user stories and features can then be further divided to align with the necessary epic.
User stories
A User Story describes the goal of the user and covers what they need and why. They often follow a structure such as:
As a __[user]__
I want/need/would like ___[action]___
so that ___[outcome/goal]___
Below is an example of what a user story might look like.
As a Somerset Resident, I want to filter search results so that I can easily find what is relevant to me.
A user story must describe the user goal end to end but be small enough that it can translate directly to a task solved through a sprint without having to break it down further. It must not contain a solution but outline the need from a user perspective. This is the differentiating factor from an Epic.
Acceptance criteria should be written for each user story so that we know when we have met the user goals.
Epics
An epic is usually a group of user stories that contribute to a larger strategic objective. An Epic describes the outcome we are trying to achieve – the business requirement. We can prioritise Epics so we know which user stories to work on first.
For example, an Epic might be ‘As a customer I want to find information online’ which will require many different user stories in order to determine how to find that online information. Epics are great for grouping together requirements and working towards that greater goal.
Epics also help you to communicate with your business – we will talk in user stories to the development team, but more likely in epics to our stakeholders.
Features
A feature is a solution to either one or multiple user stories or problems. It describes ‘what’ it is we will deliver. These will likely be created by developers, designers and others who are part of the delivery of the service, system, or digital solution. An example of a feature might be a tick box menu to filter search results.
Tasks
Small tasks are set to deliver against each user story, and in turn, produce the feature. These may be organised in a KanBan or Planner for the development team to manage a sprint. More information on this can be found here: The Basics: Epics, Stories, Themes and Features | by Marcel Britsch | The Digital Business Analyst